Streaming Service Reliability Comparison
As more and more people are moving to primarily, or even exclusively, streaming their entertainment there is a renewed interest in the reliability and stability of the streaming services. Services that are less resilient to hiccups in internet and WiFi performance are getting more and more attention.
As a part of our overall device testing we’ve been analyzing nearly a dozen streaming services to ensure they all work reliably with our device. That lead us to an interesting idea- what if we compared service to service for stability and reliability on a poor performing network?
Unpredictable WiFi is a hallmark of travel. While we’ve been increasingly dependent on WiFi but it’s reliability hasn’t always kept up. There are several devices for homes and offices that are designed to help automatically resolve poor WiFi conditions, but none for on the road.
While poor WiFi is certainly more prevalent on the go, its not exclusive. There are still plenty of people who suffer from poor WiFi, dead spots and a variety of problems in the home. Worse, these problems can come and go based on how busy their WiFi is, neighbors usage, interference and a number of other factors.
This begs the question, which services deal with all of these real world WiFi environments the best? Which ones struggle?
The Services
We tried to pull together as many of the top services as we could. We picked all of the major players from the top streaming services.
- Netflix
- Amazon
- Hulu
- Vudu
- Disney Plus
- HBO Now
- Apple TV
- Plex
- YouTube
There are at least another half dozen new or highly subscribed to services that we could have tested. The others we considered but left outside of this test were:
- CBS All Access
- Crackle
- HBO Max (not yet available for our test device)
- Peacock (too new)
- Sling TV
- DirectTV Now
There are a number of niche services now such as Curosity Stream, Pluto TV and Fubo TV, just to name a few. If you are interested in seeing these services tested, jump over to our Facebook page or Twitter and let us know.
Test Devices
We cover more on why we made these choices in our methodology but for now, lets talk a little about our test devices.
Streaming Stick
We could have literally picked from any of a dozen streaming devices. Some are higher power than others. Some perform better than others as we discovered when we compared travel streaming sticks in a similar test a few weeks ago.
We settled on the Roku Stream Stick for a few reasons:
- Almost all of the streaming services were available on it
- It was a neutral party that wouldn’t potentially favor one service over another
- Most apps are developed and provided by the streaming providers or a third party therefore nobody would have a decided advantage.
Router/WiFi
For flexibility we used our own Go Connect Travel Router device at close range. This gave us the opportunity to control the environment very well.
Methodology
We wanted to be as consistent as possible. While nobody will confuse this blog post for a full lab test, we did want to ensure we were putting on a fair comparison. We used the same conditions for each streaming service. This includes the same WiFi end point and the same device. We attempted to use the same type of show – an recent original in high quality. We wanted to eliminate encoding quality and age as a factor. We allowed for the same playback and buffer time for each.
As with our other tests we opted for 1080p rather than 4K. There simply aren’t enough 4K TVs in hotels and Airbnb’s to make that comparison worth it, but we understand this is of interest to people in their homes. However, 4K takes 4 times the bandwidth and we felt it would be too easy to have problems or downgrades, even if the connection wasn’t that bad. 1080p is still the norm, but we’d certainly be willing to consider coming back and re-doing it in 4K if that was of interest to our followers.
We used the same internet connection and router. This ensured there were no differences in the performance. In terms of how we simulated bad internet we applied the same impacts to the speed and quality across all three for consistency. We’re going to get a bit technical, so if you don’t care about that part skip to the bottom.
Scoring System
To help us categorize and rate the performance we focused on three key areas of using a streaming service: User Interface browsing/selecting a show, Stability of the Stream, and Quality of the stream (how much it degraded from no network congestion).
We gave a score of 0-3 for each of these areas.
- 0 = it didn’t work at all
- 1 = works poorly
- 2 = work tolerably
- 3 = works well or perfectly
Also because the most important thing was that the stream played, even if it was painful to get to or of lower quality, we made stream stability worth twice as much.
Technical Details Of Simulated Poor WiFi Network
For the technies who may be interested, the way we simulated bad internet was to add latency, packet corruption and packet loss. This ultimately created some very harsh conditions. In addition to these three types of unreliability and delay, like you might experience, we further saturated the WiFi network with traffic.
The result was we turned a 30MB WiFi stream with < 10ms and no packet corruption or loss, which would be a dream to find in most hotels, into one in some cases than ran <250KB with 1 second of delay and 20% packet loss and corruption. It was brutal, but you might be surprised how many services were still functional.
However, we didn’t just add it linearly. We used a tool to simulate some variation. So while below we may note a latency of 1s, it was actually 1s give or take 100ms, 25% of the time. We also did a similar variation with packet loss and corruption. This helps ensure there was some unpredictability to the network traffic, which is more realistic.
We knew from previous testing that this was not beyond the point of failure for at least one service (Netflix). So we used it as our foundation.
Results
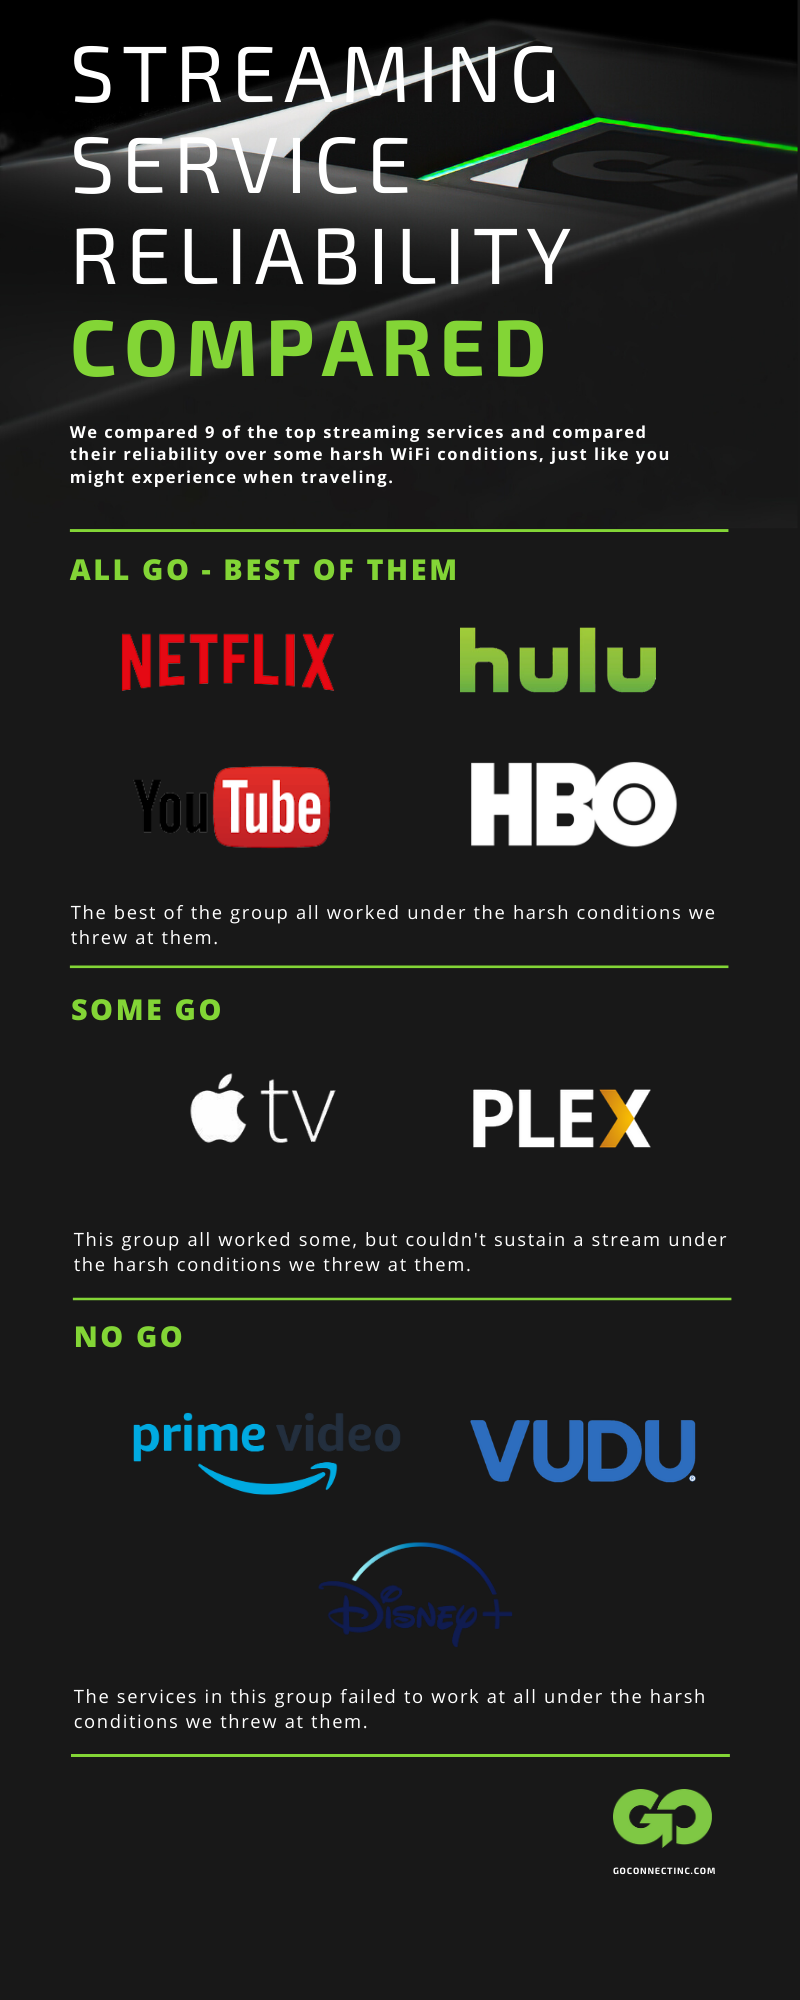
We’ve known for a while that Netflix is generally considered one of the most reliable services. For a good reason, their entire business depends on it. They’ve also been doing it for a long time. Others that did well either have significant business in the streaming world (YouTube) or have been long term players in the streaming business (HBO Now). Rounding out the top tier with Netflix, HBO and YouTube was Hulu, another long term player with a significant following, it’s not terrible surprising to find them here.
Moving down to our next tier was Plex and Apple TV. While both did a solid job of keeping their user interface going on a terrible network, neither was capable of sustaining a stream under such rough conditions.
Rounding out the list was the services that couldn’t handle the poor network at all. Amazon, while generally known to us as less resilient, was unable to even load. Same with Disney+ and Vudu.
As regular testers of streaming services we didn’t walk away with many surprises. We looked at a number of these services to determine which made sense for our best streaming sticks for travel tests so we had an idea what we might see. So, how did our test results compare to real world experiences?
Results Compared To User Surveys
We recently read a survey by JD Power about streaming reliability. So how did our test results compare to some of their feedback of opinions?
To simplify the comparison we took their values and translated them into our tiers for comparison. We are including our total score, their issues per per hour for the ones they reported on that matched.
| Service | Go’s Rating | Go’s JD Rating | Actual Go Score | Actual JD Score |
| Netflix | Good | Good | 2.67 | .07/hr |
| Hulu | Good | Average | 2.67 | .11/hr |
| Disney+ | Poor | Average | 0.00 | .12/hr |
| YouTube | Good | Average | 3.33 | 0.13/hr |
| Amazon | Poor | Average | 0.00 | .11/hr |
As you can see there is some variation to the scores, but they generally line up with what we found during our tests. The biggest difference was with YouTube, which scored at the lower end of the services and we found YouTube to be the most resilient of the group.
The other big difference was Amazon. In most of our testing Amazon performed relatively poorly. It’s tolerance has consistently come in significantly lower than the top services (i.e. Netflix, HBO). One explanation for this difference is that we took our bad WiFi to an extreme.
We didn’t have access to the full test results to compare the remaining services outside of these 5. However, we do think it helps validate our results being consistent with the real world.
Results Table
Here is the our complete scoring table of all of the services and their results in streaming stability, user interface, and stream quality.
| Service | Stream Stability (x2) | User Interface | Stream Quality | Score |
| Netflix | 2 | 2 | 2 | 2.67 |
| Amazon* | 0 | 0 | 0 | 0.00 |
| Hulu | 2 | 2 | 2 | 2.67 |
| Vudu* | 0 | 0 | 0 | 0.00 |
| Disney Plus* | 0 | 0 | 0 | 0.00 |
| HBO Now | 2 | 2 | 3 | 3.00 |
| Apple TV** | 0 | 2 | 3 | 1.67 |
| Plex** | 0 | 3 | 3 | 2.00 |
| YouTube | 3 | 2 | 2 | 3.33 |
Services with a * failed to load the user interface or displayed an error message.
Services with a ** the user interface worked but the stream failed to play or begin playing but froze, making them unusable.